Cost Monitoring
Monitor token consumption and costs for your AI model deployments in Azure AI Foundry. There are two complementary ways to track usage:
- Token Usage — AI Foundry Monitoring tracks requests, prompt tokens, completion tokens, and latency for each model deployment. Great for understanding usage patterns over time.
- Cost Analysis — Azure Cost Management shows actual spend in EUR/USD broken down by model tier and token meter type. Great for budgeting and identifying cost drivers.
Accessing the Monitoring Dashboard
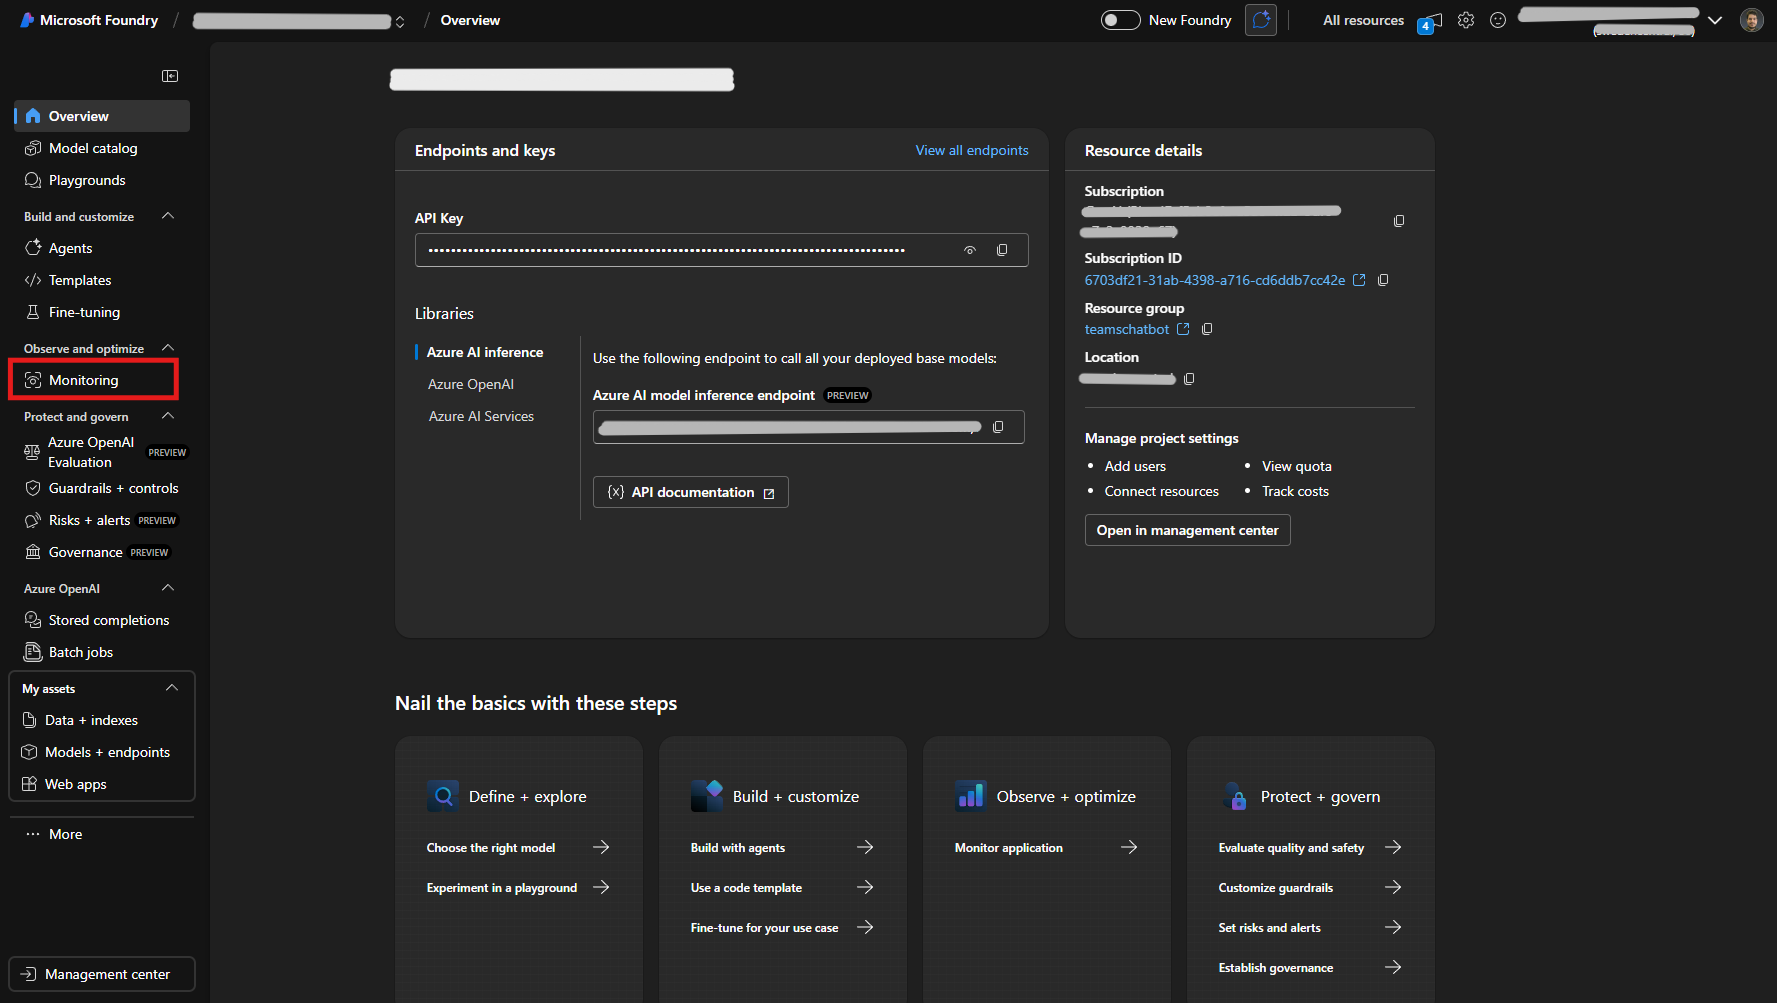
- Go to ai.azure.com and open your AI Foundry project
- In the left sidebar, expand Observe and optimize
- Click Monitoring
Reviewing Token Usage Metrics
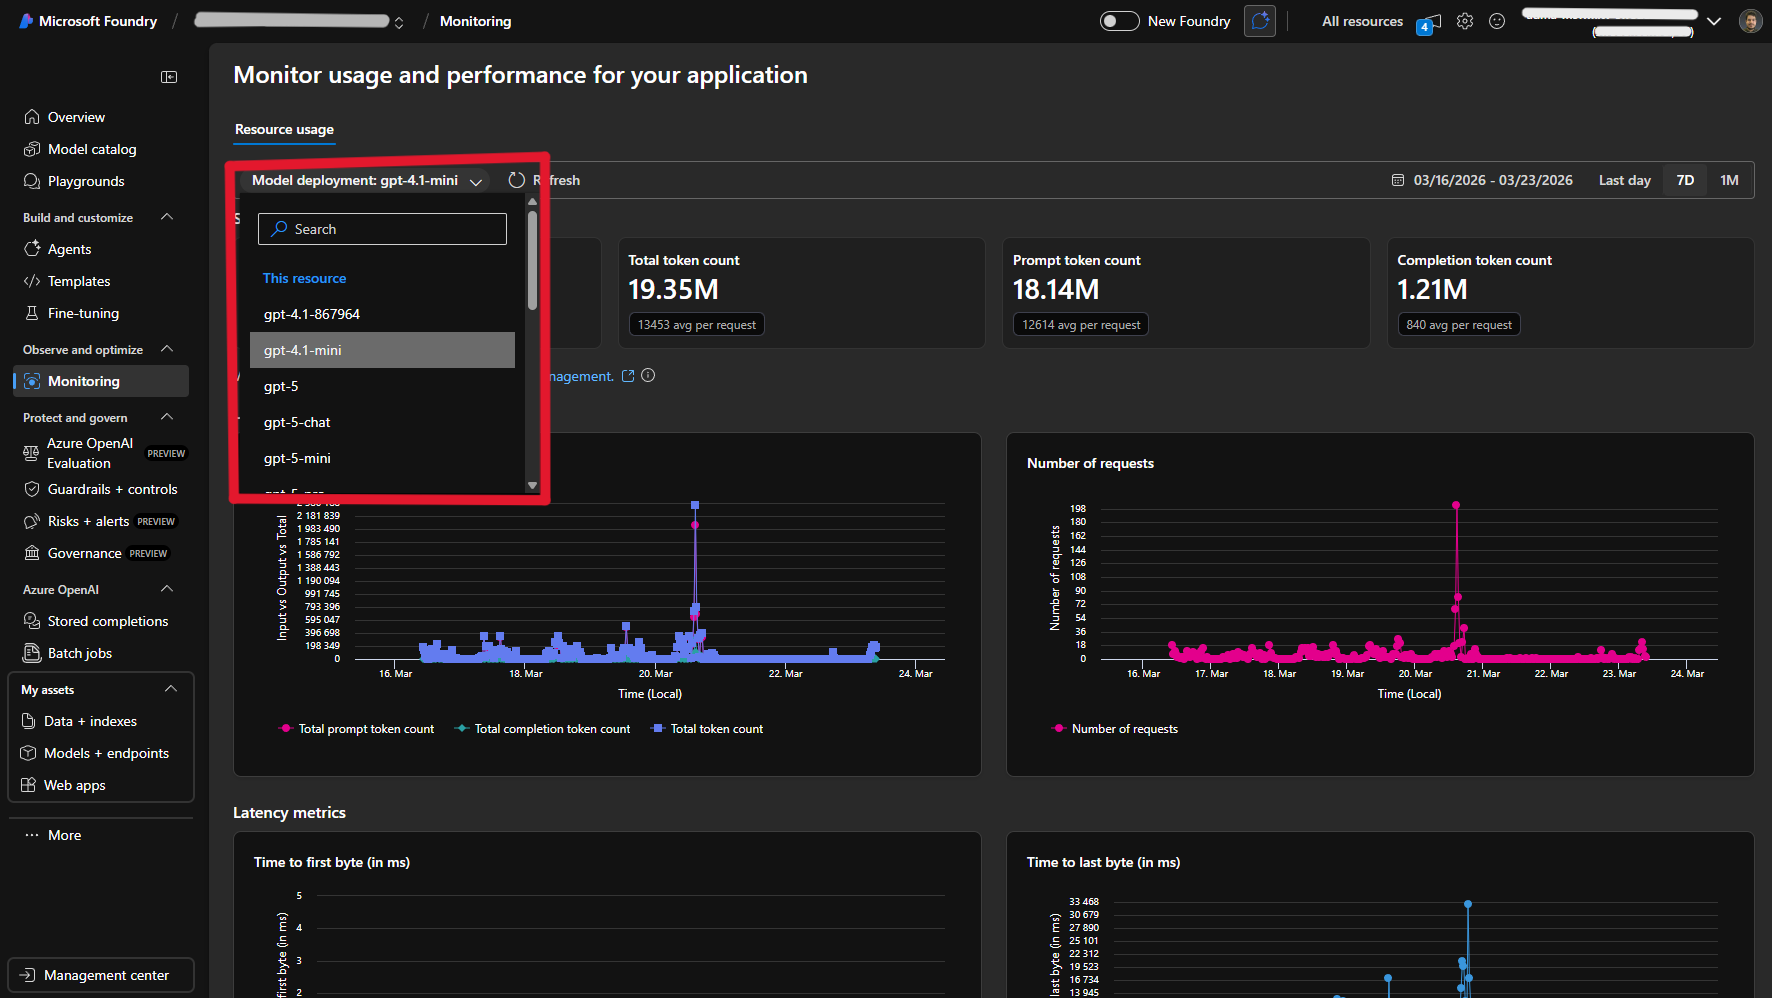
The Monitoring page provides key metrics for each model deployment:
- Total Requests — Number of API calls
- Total Token Count — All tokens consumed
- Prompt Tokens — Input tokens sent
- Completion Tokens — Output tokens generated
Additionally, you can view charts for input vs. output tokens over time, number of requests over time, and latency metrics (time to first byte and time to last byte).
Use the date range picker (top-right) to view the last day, 7 days, or 1 month of data. Use the Model deployment dropdown at the top of the page to switch between deployments.
Checking Costs via Azure Cost Management
To see actual costs broken down by model and token type:
- From the Monitoring page, click the Azure Cost Management link
- Alternatively, go to portal.azure.com and navigate to Cost Management + Billing
- Filter by your Cognitive Services resource
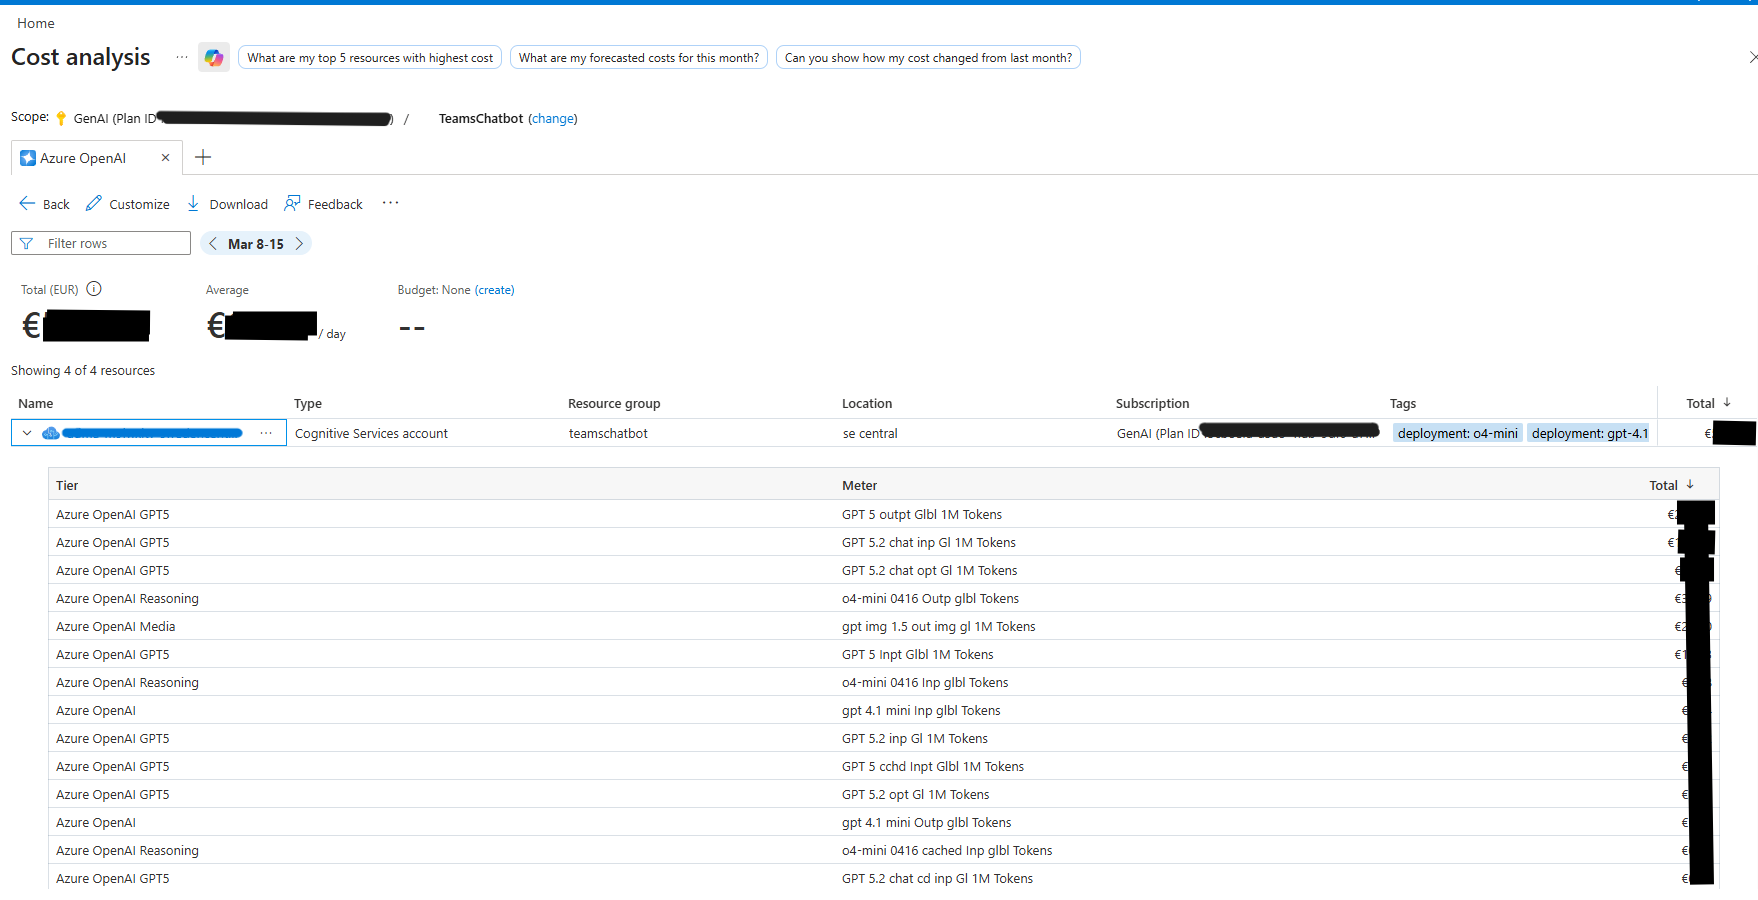
The cost breakdown shows:
- Total cost in EUR (or your configured currency)
- Average daily spend
- Cost per model tier (e.g. GPT5, Reasoning, Media)
- Cost per token meter (input, output, cached, chat)
- Date range filtering for custom periods
Tips
- Compare models — Use the deployment dropdown on the Monitoring page to switch between models and compare their usage patterns.
- Optimize spend — Track prompt vs. completion tokens. If prompt token counts are disproportionately high, consider reducing prompt size to lower costs.